")
")
What does OEE bring you?
OEE (Overall Rate of Return) is certainly the best-know performance indicator in production.est certainement l'indicateur de performance le plus connu dans la production. There are good reasons for this: with a moderate investment, it allows you to initiate a process of continuous improvement of production and reap significant gains. While calculating OEE allows you to compare lines or teams to each other or measure your productivity progress from day to day, quality OEE tracking software won't stop there. It will allow you to analyse the causes that impact OEE and provide the keys to improving your productivity.
You will be able to act on several factors:
- Reduced downtime: by identifying the most frequent causes of downtime, the OEE software allows you to take priority action on the most frequent or most penalizing downtimes. The experimental law of 80/20 (80% of stoppages are due to 20% of the causes) prevents you from dispersing your action and allows you to concentrate on the essentials.
The COOX Software also allows you to analyse the distribution of stoppages over time, to identify for example that these occur more often at the time of shift changes or at night, and to think about how to compensate for them at the level of your organization.
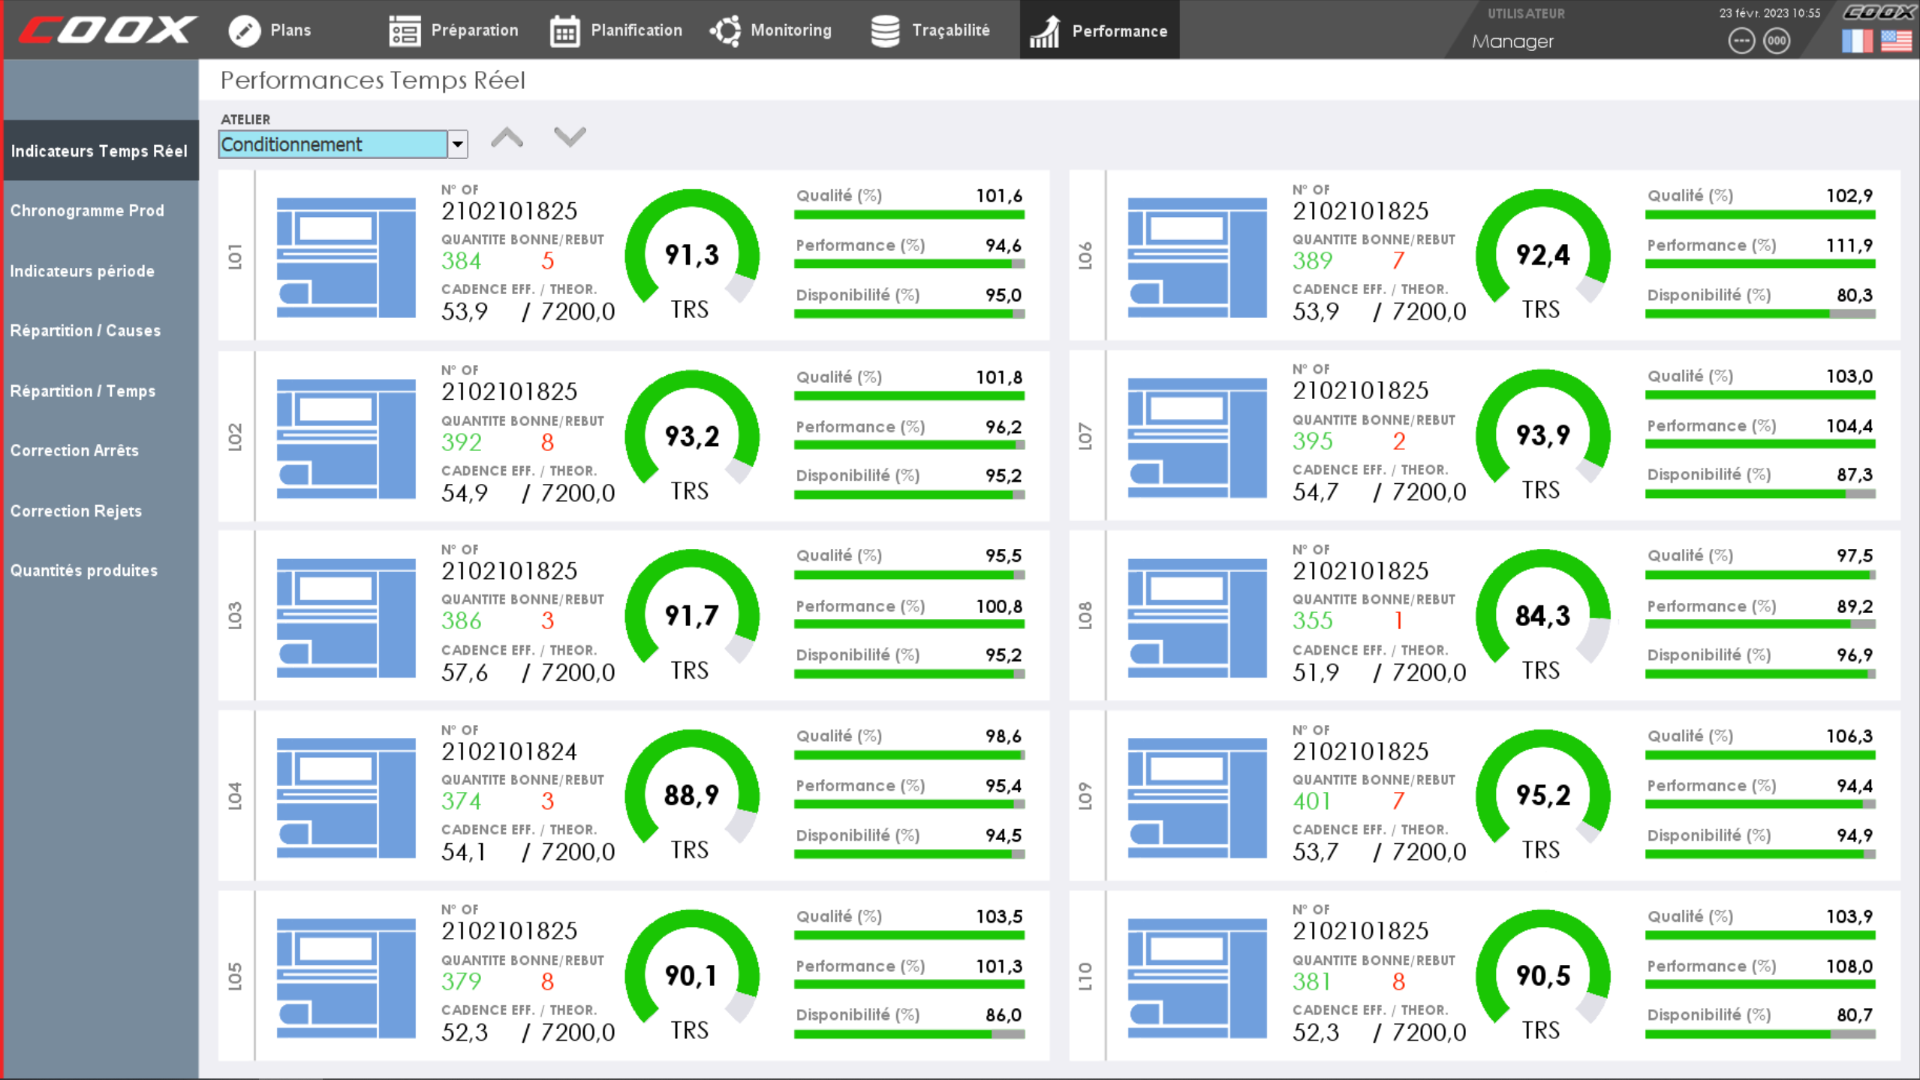
The COOX Software works in real time: the degradation of OEE therefore allows the production manager to intervene and correct the causes of this performance degradation at time T. The OEE produced by COOX is thus an indicator which makes it possible to ensure the efficiency of each production stage. - Reduction of the causes of rejections: with the same approach, you will be able to reduce the non-quality rates by focusing on their main causes.
- Control of cadences and micro-stops: under-cadences and micro-stops are sometimes difficult to identify without a reliable indicator. However, They can cause you to lose valuable productivity points.
- Comparison of the actual production with the theoretical production: Essential, a comparative curve of the real production compared to the theoretical allows the operator to control his objective.
At the manager level, indicators calculated in sliding mode alert in the event of a significant stall.
To bring you all these benefits, there are however two conditions:
- Entering information should not be a burden for operators (for entering information) and for managers (for exploiting information). This is unfortunately often the case for solutions that are not based on specialized software (paper reporting, Excel sheets, etc.)
- The software must be based on reliable data. This will not be possible if the information is entered a posteriori in a purely declarative mode. At the end of the day, we will remember the stop which lasted 45 min but which is exceptional, we will often forget to mention several 5 min stops which are repetitive and on which it would be necessary to act. For this, the software must capture the information in real time, the best solution being for the software to calculate the duration of the stop itself.
All these gains are brought to you by the COOX solution and the MESbox QPI (Quality & Performance Indicators).